Clinical relevance of secreted proteins in a large patient cohort
Source:vignettes/bulkCohort.Rmd
bulkCohort.RmdThis tutorial demonstrates how to infer the signaling activity of secreted proteins from a large data cohort, and then calculate the relevance of their activity to clinical variables. The input expression values, from either RNA sequencing or MicroArray, should be transformed by log2(x+1). Of note, x could be FPKM, RPKM, or TPM for RNA-Seq data.
For this demonstration, we use an immunotherapy cohort of patients with pancreatic cancer. Using the SecAct framework, we identify secreted proteins whose activity levels are associated with clinical outcomes.
Prepare expression data
This section shows how to read an expression matrix to the R environment.
library(SecAct)

# prepare expression matrix
dataPath <- file.path(system.file(package="SecAct"), "extdata/")
expr <- read.table(paste0(dataPath,"Pancreatic_Nivolumab_Padron2022.logTPM.gz"), check.names=F)
Infer secreted protein activity
We use SecAct.activity.inference to infer the signaling
activity of secreted proteins across patients.
If your data have control samples (e.g., normal patients), you can
assign them to inputProfile_control. SecAct
would normalize each gene’s expression values with the control samples,
i.e., subtracting the mean gene expression of control samples.
If not available, just set inputProfile_control=NULL
(default). SecAct would normalize the expression values of
each gene to zero mean across all input profiles. In other words, the
mean gene expression of all input profiles are regarded as control.
# infer activity; ~2 mins
res <- SecAct.activity.inference(inputProfile=expr, inputProfile_control=NULL)

# res$zscore stores activity
act <- res$zscore

# show activity
act[1:6,1:3]
The inferred protein activity is a relative measure. A positive value indicates high activity in the corresponding patients, while a negative value signifies low activity.
Calculate clinical relevance
We next calculate the risk score for each secreted protein by linking
their activity levels with clinical information. For the clinical file,
please make sure the name of the 1st and 2nd columns are “Time” and
“Event”, respectively. SecAct.coxph.regression will conduct
Cox proportional hazard (PH) regression, with risk scores represented as
z-scores (Coef / StdErr) from the two-sided Wald test. Of note, clinical
covariates (e.g., age, gender, stage) would also be considered in
regression if available.
# read clinical infomation
clinical <- read.table(paste0(dataPath,"Pancreatic_Nivolumab_Padron2022.OS_Nivo+Sotiga+Chemo"))

head(clinical)

##    Time Event Age Gender ECOG
## 8   834     0  55      1    0
## 13   28     1  60      0    1
## 15  273     1  69      0    0
## 22  159     1  69      0    1
## 24  569     0  62      0    0
## 25  264     1  66      1    1

# compute risk score
riskMat <- SecAct.coxph.regression(act, clinical)

head(riskMat)
For the risk score z, a positive value means the secreted protein is associated with poorer survival while a negative value means the secreted protein is associated with better survival.
Visualize risk score
User can visualize any secreted proteins of interest using
SecAct.lollipop.plot. Here, we select the top high and low
risk secreted proteins (SPs), which are associated with poorer and
better survival, respectively.
# select the top secreted proteins
n <- 10
high.risk.SPs <- names(sort(riskMat[,"risk score z"],decreasing=T))[1:n]
low.risk.SPs <- names(sort(riskMat[,"risk score z"]))[1:n]

SPs <- c(high.risk.SPs, low.risk.SPs)
# user can assign any secreted proteins to SPs

# generate a vector
fg.vec <- riskMat[SPs,"risk score z"]

# visualize in lollipop plot
SecAct.lollipop.plot(fg.vec, title="Risk score z")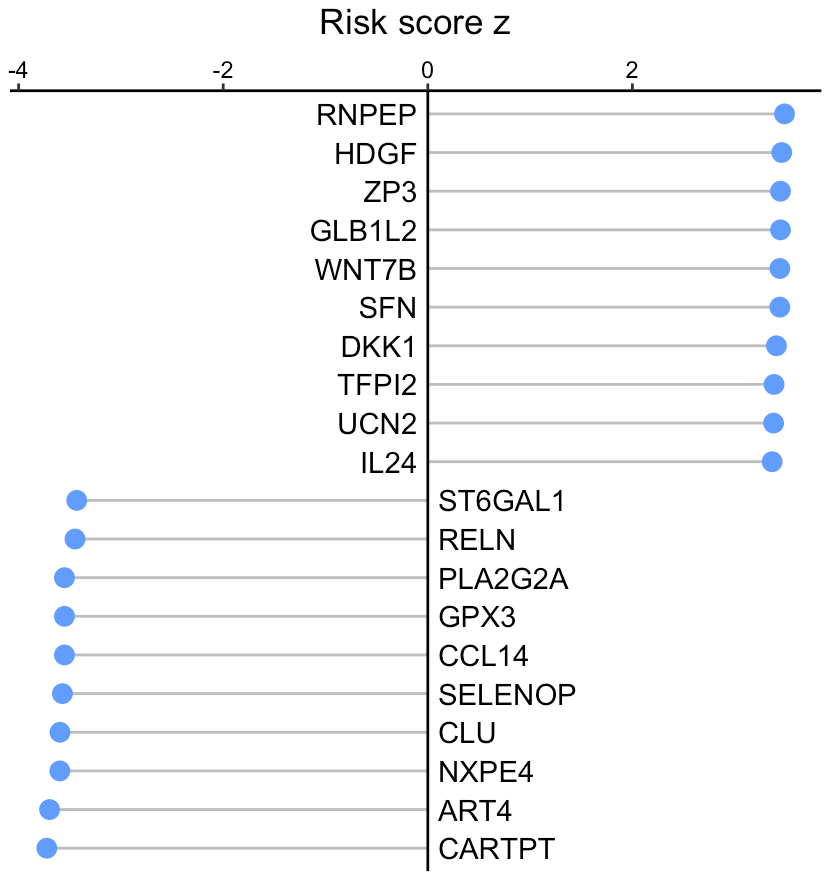
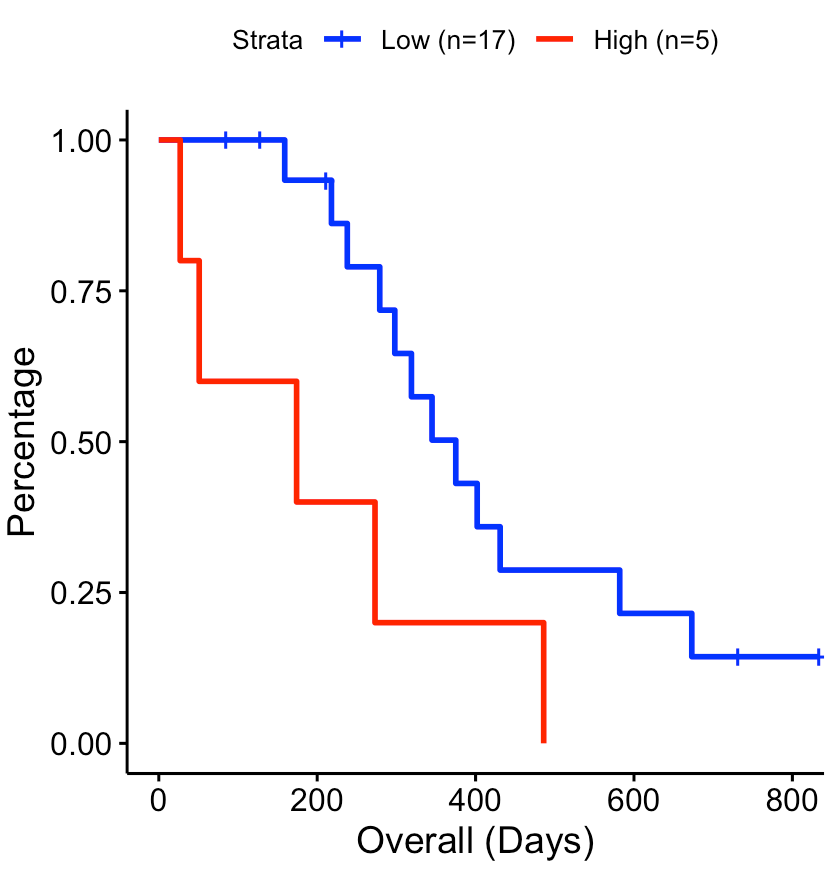
Draw survival plot
User can select a secreted protein of interest to draw its survival
curve using SecAct.survival.plot. The activity cutoff was
selected by maximizing the difference between high and low activity
patient groups.
# Take secreted protein WNT7B as an example
riskMat["WNT7B",]

# visualize in survival plot
SecAct.survival.plot(act, clinical, "WNT7B", x.title="Overall (Days)")