In this vignette, we will demonstrate how to use SpaCET
to calculate and visualize spots’ gene set score for the in-house or
user-defined gene sets. The in-house gene sets include hallmarks, cancer
cell states, and tertiary lymphoid structures (TLS).
Create SpaCET object
To read your ST data into R, user can create an SpaCET object by
using create.SpaCET.object or
create.SpaCET.object.10X. Specifically, if users are
analyzing an ST dataset from 10x Visium, they only need to input
“visiumPath” by using create.SpaCET.object.10X. Please make
sure that “visiumPath” points to the standard output folders of 10x
Space Ranger, which has both “filtered_feature_bc_matrix” and “spatial”
folders.
library(SpaCET)

# set the path to the in-house breast cancer ST data.
# user can set the paths to their own data.
visiumPath <- file.path(system.file(package = "SpaCET"), "extdata/Visium_BC")

# load ST data to create an SpaCET object.
SpaCET_obj <- create.SpaCET.object.10X(visiumPath = visiumPath)

# calculate the QC metrics
SpaCET_obj <- SpaCET.quality.control(SpaCET_obj)
Calculate hallmark score
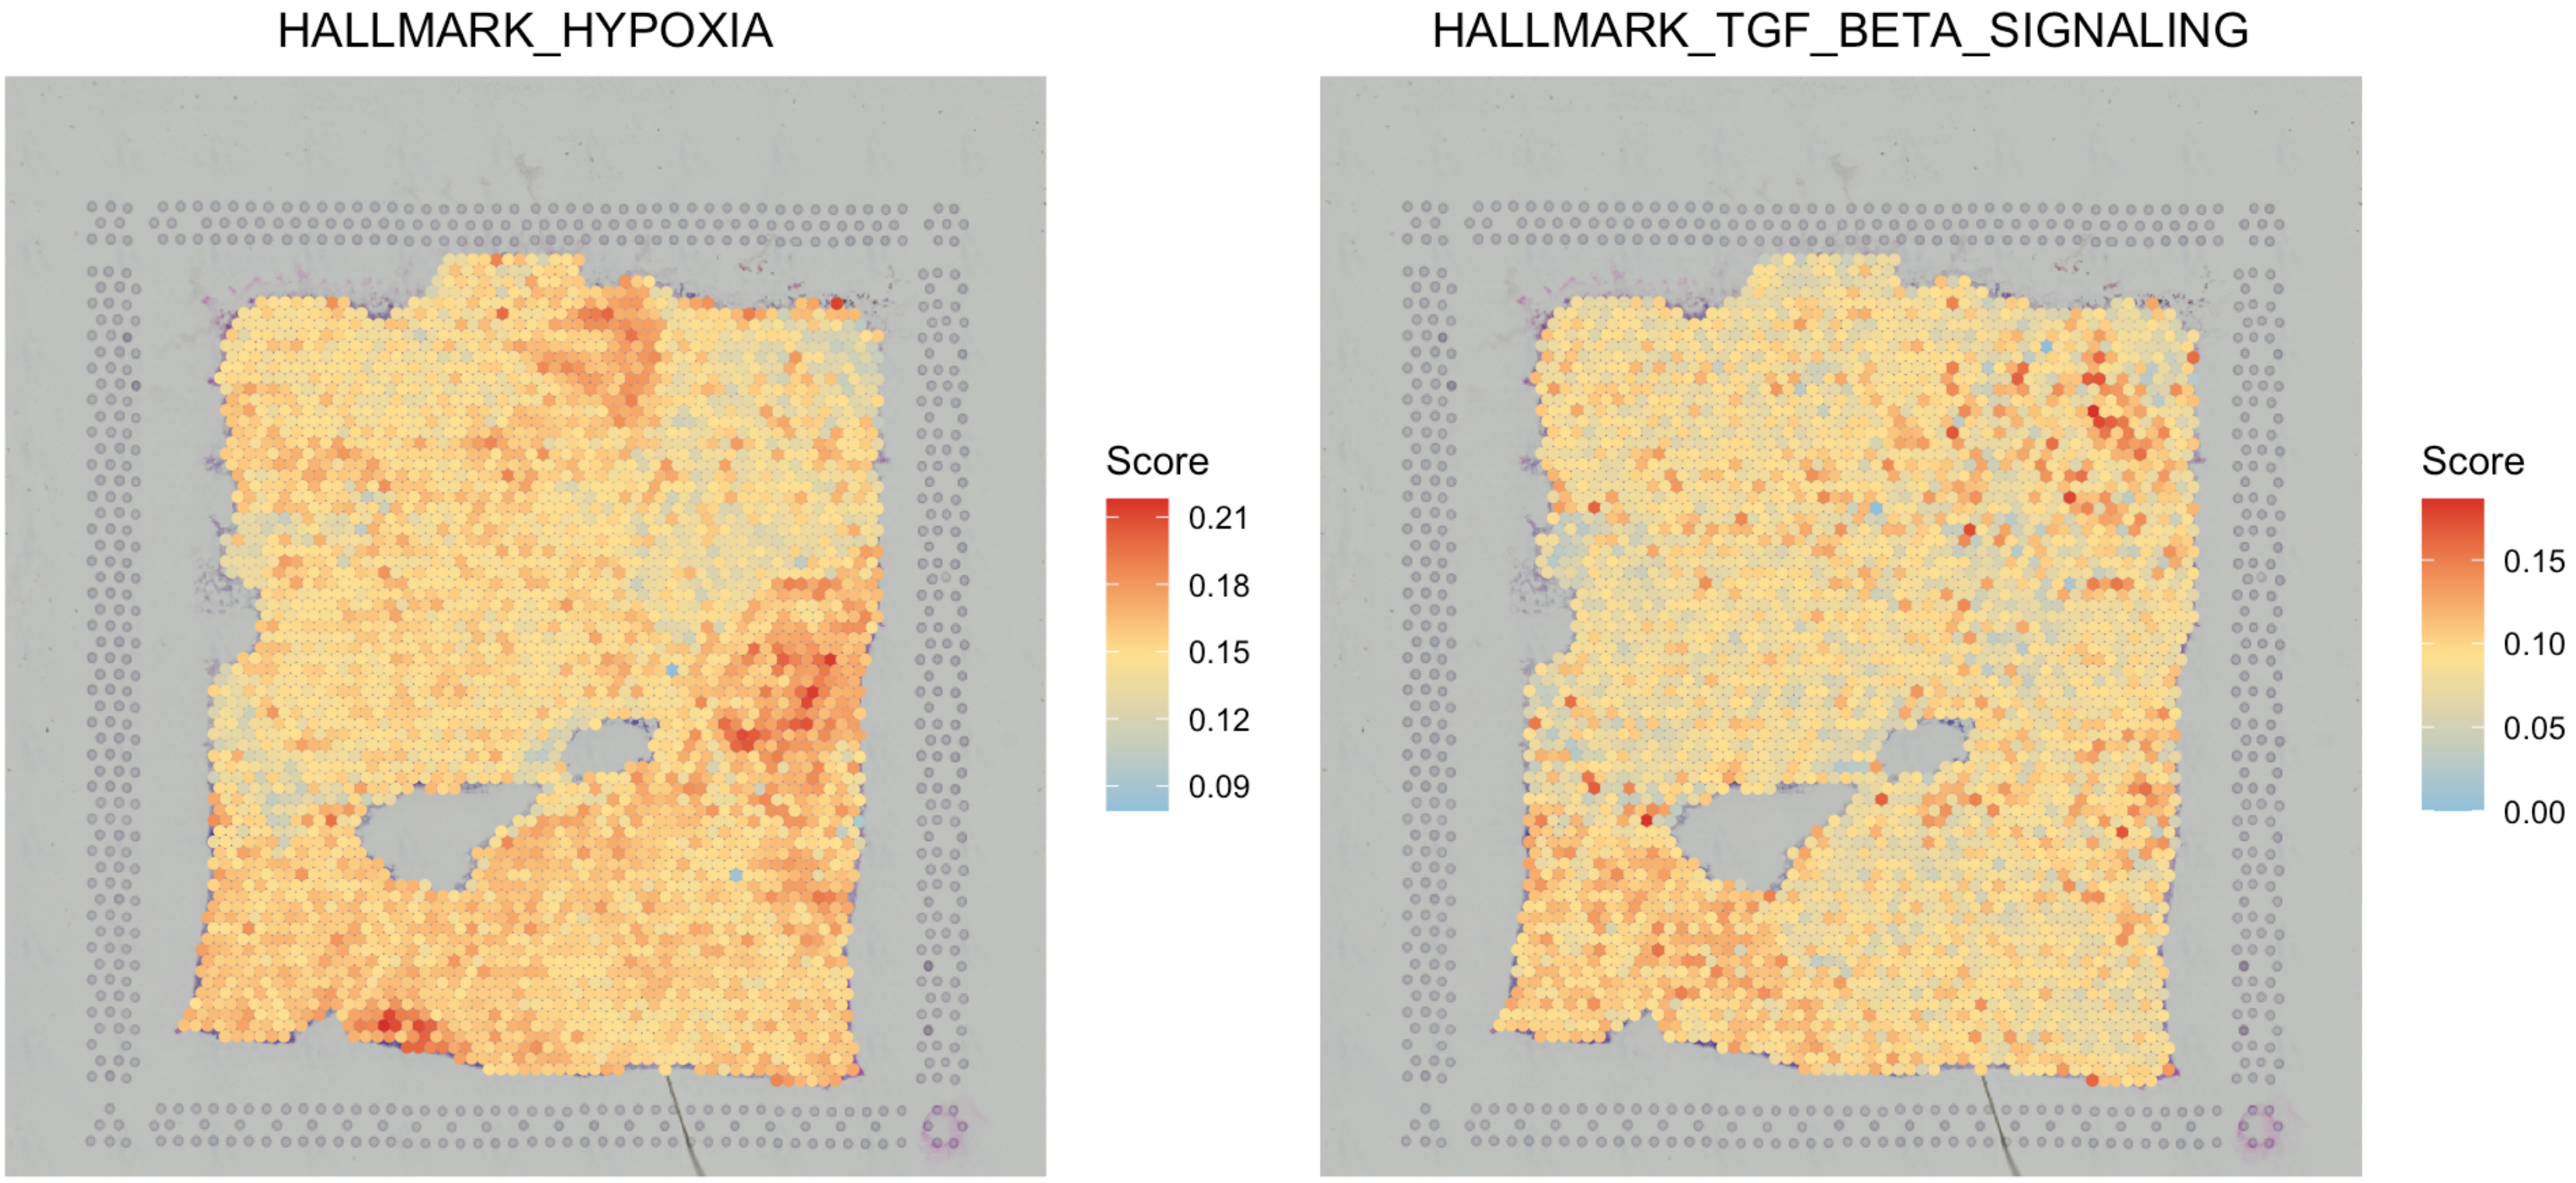
The in-house 50 hallmark gene sets were collected from MSigDB and user just need to set
GeneSets as “Hallmark”. SpaCET.GeneSetScore
will call UCell package to calculate gene set score. The
results are stored in SpaCET_obj@results$GeneSetScore as a
matrix.
# run gene set calculation
SpaCET_obj <- SpaCET.GeneSetScore(SpaCET_obj, GeneSets="Hallmark")

# show results
SpaCET_obj@results$GeneSetScore[1:6,1:6]

# show all gene sets
rownames(SpaCET_obj@results$GeneSetScore)

# visualize two gene sets
SpaCET.visualize.spatialFeature(
  SpaCET_obj,
  spatialType = "GeneSetScore",
  spatialFeatures = c("HALLMARK_HYPOXIA","HALLMARK_TGF_BETA_SIGNALING")
)
Calculate cancer cell state score
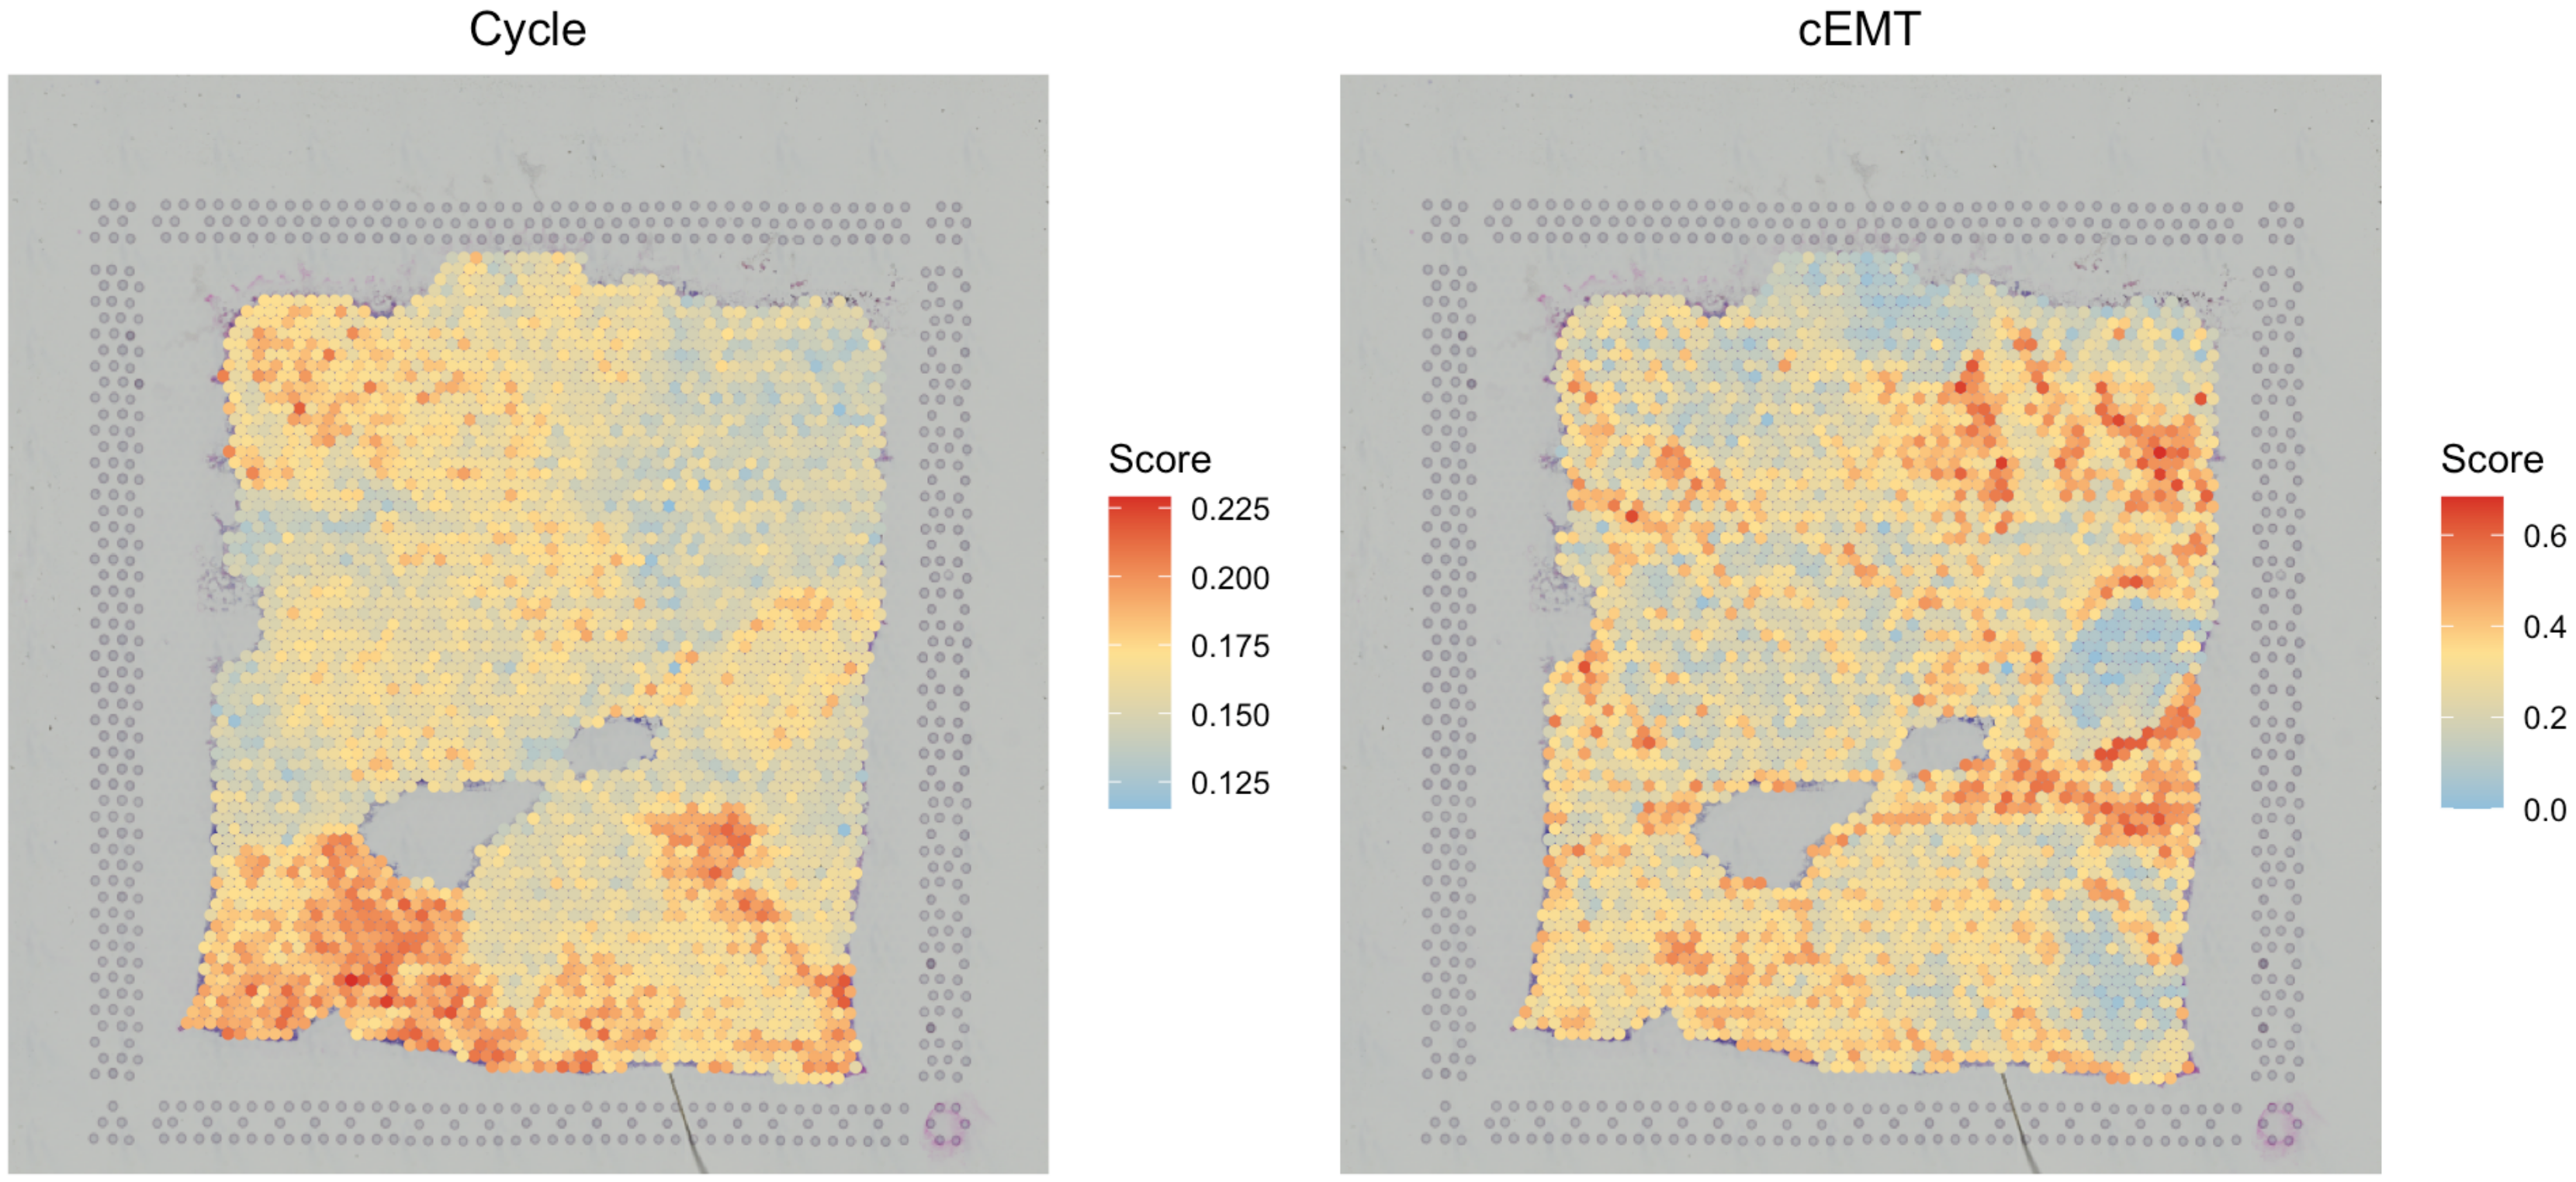
A recent study identifies a catalog of gene modules whose
expression defines 16 recurrent cancer cell states through a pan-caner
single-cell RNA-sequencing analysis. In order to use them, user just
need to set GeneSets as “CancerCellState”.
# run gene set calculation
SpaCET_obj <- SpaCET.GeneSetScore(SpaCET_obj, GeneSets="CancerCellState")

# show all gene sets
rownames(SpaCET_obj@results$GeneSetScore)

# visualize two gene sets
SpaCET.visualize.spatialFeature(
  SpaCET_obj,
  spatialType = "GeneSetScore",
  spatialFeatures = c("CancerCellState_Cycle","CancerCellState_cEMT")
)
Calculate TLS score
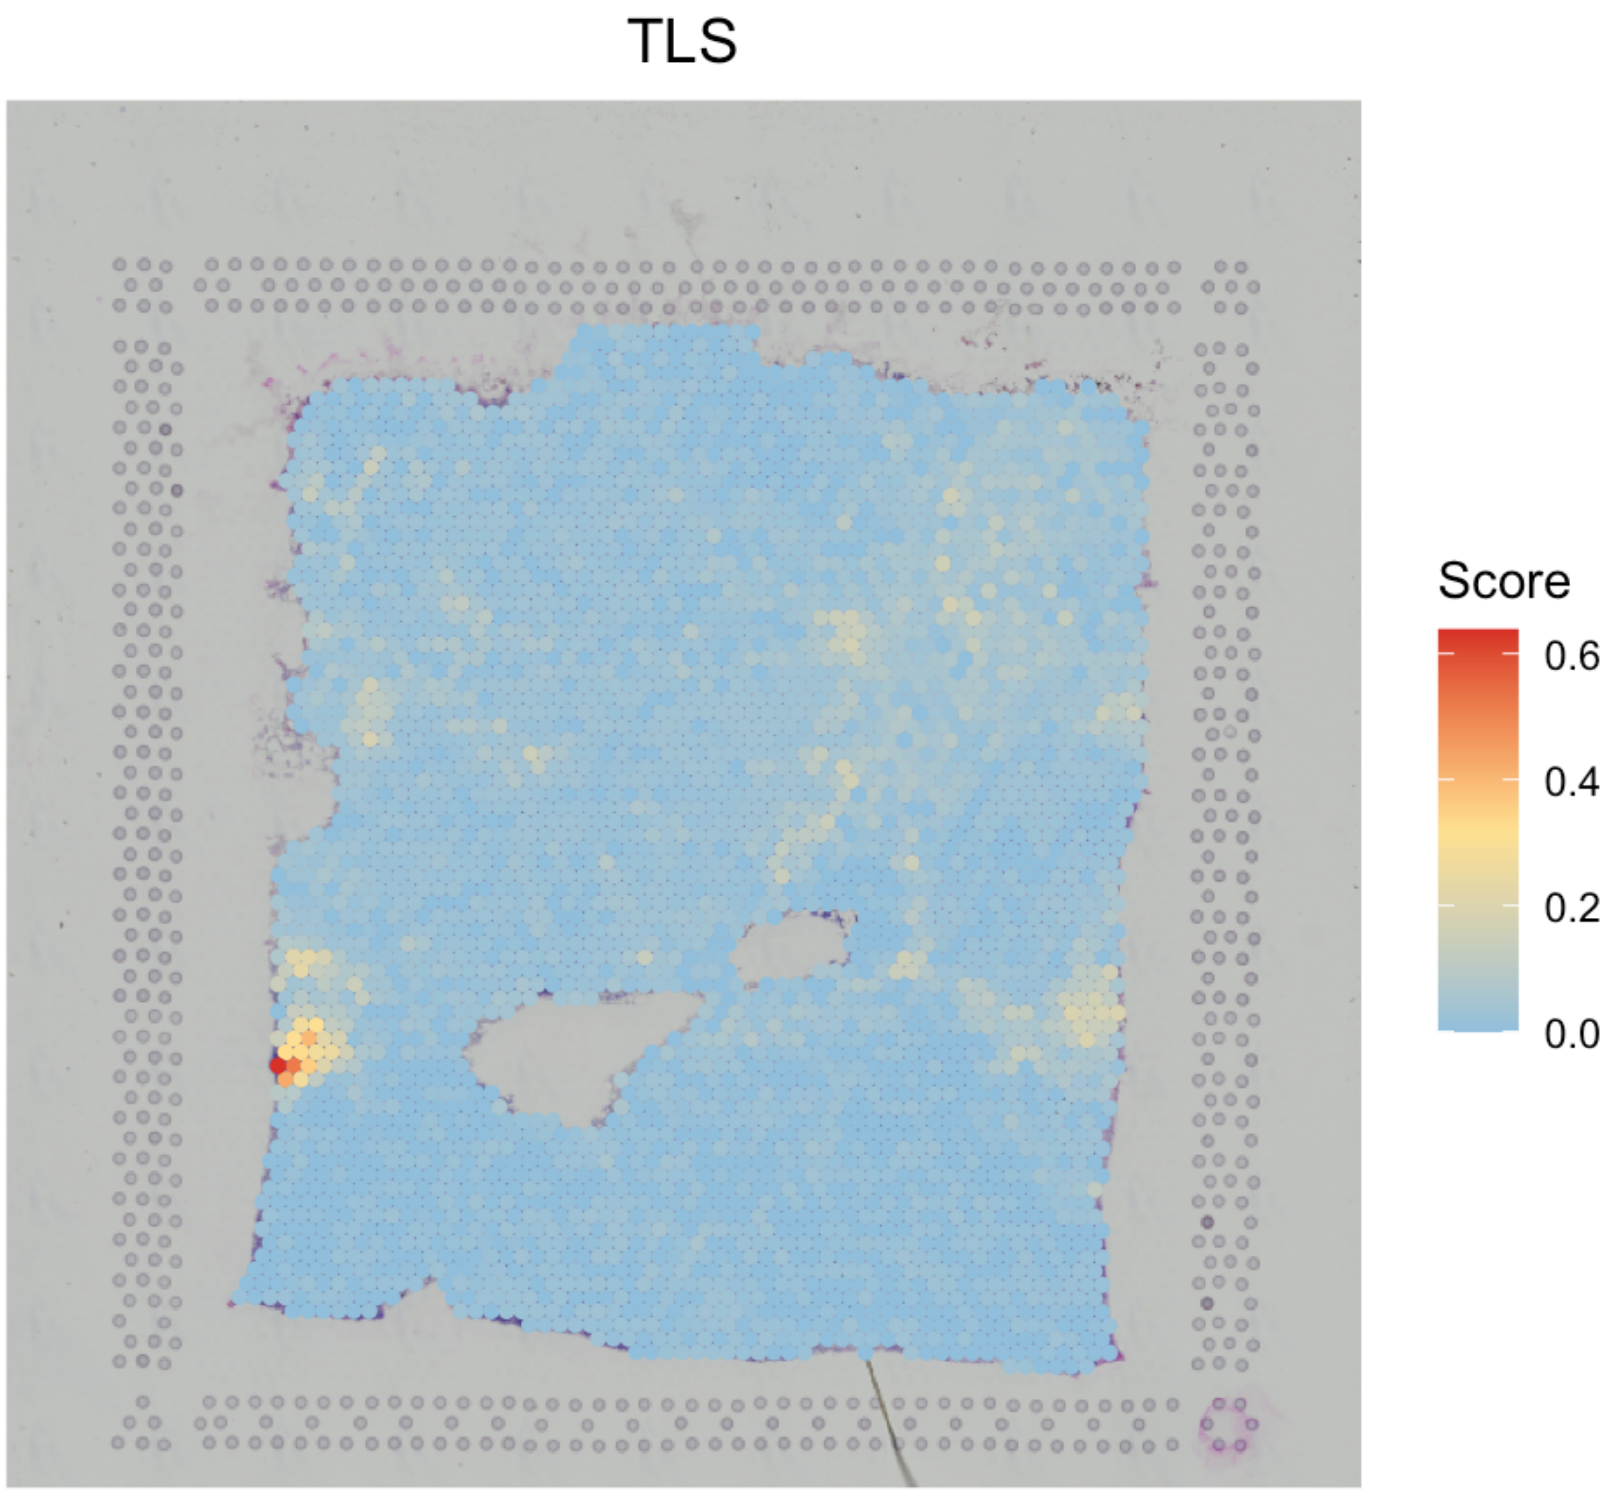
User just need to set GeneSets as “TLS” to calculate
tertiary lymphoid structure score. We collected a 30-gene TLS signature
from this study.
# run gene set calculation
SpaCET_obj <- SpaCET.GeneSetScore(SpaCET_obj, GeneSets="TLS")

# visualize TLS
SpaCET.visualize.spatialFeature(
  SpaCET_obj,
  spatialType = "GeneSetScore",
  spatialFeatures = c("TLS")
)
Calculate other gene sets’ score
There are two methods to build customized gene sets. 1) Generate a
list to define some simple gene sets (e.g., T cell and Myeloid
signatures). 2) Download a gmt file from MSigDB (e.g., GO Ontology), and then use
read.gmt to read this file as a list.
# 1)
gmt1 <- list(
  Tcell = c("CD2","CD3E","CD3D"),
  Myeloid = c("SPI1","FCER1G","CSF1R")
)
SpaCET_obj <- SpaCET.GeneSetScore(SpaCET_obj, GeneSets = gmt1)

# 2)
gmt2 <- read.gmt("Path_to_gmt_file")
SpaCET_obj <- SpaCET.GeneSetScore(SpaCET_obj, GeneSets = gmt2)